Cell Segmentation in Microscopy Images
The Problem
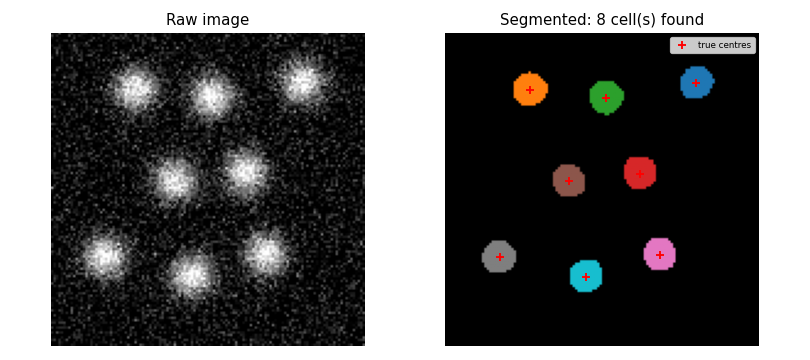
- Fluorescence microscopy makes individual cells visible as bright spots on a dark background.
- Counting cells and measuring their sizes by hand is impractical at scale.
- Automated segmentation identifies which pixels belong to which cell using image processing.
- The same pipeline is used in drug-discovery assays, developmental biology, and pathology.
Representing a Fluorescence Image
- Each cell is modelled as a 2-D Gaussian blob centred at $(x_c, y_c)$:
$$I(x, y) = B \exp\!\left(-\frac{(x - x_c)^2 + (y - y_c)^2}{2\sigma^2}\right)$$
- $B$ is the peak brightness and $\sigma$ is the width of the cell in pixels.
- Multiple cells are summed; independent Gaussian noise is then added and intensities are clipped to zero (a negative photon count is unphysical).
- Cells are placed so that no two centres are closer than
MIN_SEPARATIONpixels. This separation is chosen large enough that the midpoint intensity between two adjacent cells falls below the operating threshold (see "Choosing the threshold" below).
SEED = 7493418  # RNG seed
IMAGE_SIZE = 128  # pixels per side; kept small for fast tests
N_CELLS = 8  # number of cells to place
CELL_SIGMA = 6  # Gaussian half-width of each cell (pixels)
CELL_BRIGHTNESS = 1.0  # peak intensity (image values are in [0, 1])
NOISE_SCALE = 0.15  # std dev of additive Gaussian noise

# Minimum centre-to-centre separation that keeps midpoint intensity below the
# operating threshold of 0.5.  For two Gaussians of amplitude A and sigma σ
# separated by distance d, the midpoint value is 2A·exp(−d²/(8σ²)).
# Setting this below 0.5 gives d > 2σ·sqrt(2·ln(4A)) = 2·6·sqrt(2·ln(4)) ≈ 19.8.
# We use 24 pixels for a comfortable margin.
MIN_SEPARATION = 24
def make_image(
    n_cells=N_CELLS,
    sigma=CELL_SIGMA,
    brightness=CELL_BRIGHTNESS,
    noise_scale=NOISE_SCALE,
    image_size=IMAGE_SIZE,
    seed=SEED,
):
    """Return (image, centers) for a synthetic fluorescence image.

    Each cell is a 2-D Gaussian with peak `brightness` and width `sigma`.
    Independent Gaussian noise with std dev `noise_scale` is added to every
    pixel.  Pixel values are clipped to [0, 1].  `centers` is a list of
    (x, y) pixel coordinates of the true cell centres.
    """
    rng = np.random.default_rng(seed)
    centers = _place_cells(n_cells, image_size, MIN_SEPARATION, rng)

    ys, xs = np.mgrid[0:image_size, 0:image_size]
    image = np.zeros((image_size, image_size))
    for cx, cy in centers:
        image += brightness * np.exp(
            -0.5 * ((xs - cx) ** 2 + (ys - cy) ** 2) / sigma**2
        )
    image += rng.normal(0.0, noise_scale, image.shape)
    image = np.clip(image, 0.0, None)  # negative counts are unphysical
    return image, centers
Step 1: Smoothing
- Raw images are noisy; the Gaussian filter replaces each pixel with a weighted average of its neighbourhood, suppressing point-to-point fluctuations.
- Convolving the signal Gaussian (sigma $\sigma$) with the filter Gaussian (sigma $\sigma_s$) gives a smoothed cell with sigma $\sqrt{\sigma^2 + \sigma_s^2}$ and peak brightness:
$$B_\text{smooth} = B \cdot \frac{\sigma^2}{\sigma^2 + \sigma_s^2}$$
- With $\sigma = 6$ and $\sigma_s = 2$ this gives $B_\text{smooth} = 36/40 = 0.90$.
def smooth(image, sigma=SMOOTH_SIGMA):
    """Return the image after 2-D Gaussian smoothing with the given sigma."""
    return ndimage.gaussian_filter(image.astype(float), sigma=sigma)
A cell has peak brightness $B = 1.0$ and Gaussian width $\sigma = 6$ pixels. After smoothing with a Gaussian filter of width $\sigma_s = 2$ pixels, the smoothed peak brightness is $B \cdot \sigma^2 / (\sigma^2 + \sigma_s^2)$. What is the result? Give your answer to two decimal places.
Step 2: Thresholding and Labelling
- Pixels above a threshold form a binary mask; connected regions in the mask are individual cells.
scipy.ndimage.labelassigns a unique integer to each connected component.- Components smaller than
MIN_CELL_SIZEpixels are discarded to remove noise artefacts.
def segment(image, threshold=THRESHOLD, min_size=MIN_CELL_SIZE):
    """Return (labeled, n_cells) from a smoothed image.

    Steps:
    1. Threshold to a binary mask (pixels above `threshold` → True).
    2. Label connected components with scipy.ndimage.label.
    3. Discard components smaller than `min_size` pixels.

    `labeled` is an integer array where 0 is background and 1..n_cells
    are the detected cells.  Components are re-numbered consecutively
    after size filtering so the label values are always contiguous.
    """
    binary = image > threshold
    raw_labeled, n_raw = ndimage.label(binary)

    # Filter by size and re-number labels.
    filtered = np.zeros_like(raw_labeled)
    new_label = 1
    for old_label in range(1, n_raw + 1):
        if np.sum(raw_labeled == old_label) >= min_size:
            filtered[raw_labeled == old_label] = new_label
            new_label += 1

    return filtered, new_label - 1
def cell_sizes(labeled):
    """Return an array of pixel counts, one per detected cell."""
    n = labeled.max()
    return np.array([np.sum(labeled == i) for i in range(1, n + 1)])
Put these cell-segmentation steps in the correct order.
- Place Gaussian blobs at random non-overlapping positions
- Add Gaussian noise and clip pixel values to zero
- Apply 2-D Gaussian smoothing
- Threshold the smoothed image to produce a binary mask
- Label connected components with
scipy.ndimage.label - Discard components smaller than
MIN_CELL_SIZEpixels
Choosing the Threshold
- The smoothed noise has standard deviation:
$$\sigma_\text{noise,smooth} = \frac{\sigma_\text{noise}}{2\sqrt{\pi}\,\sigma_s} \approx \frac{0.15}{2\sqrt{\pi}\cdot 2} \approx 0.021$$
- The operating threshold of 0.50 is approximately $24\,\sigma_\text{noise,smooth}$, so the probability of a noise pixel exceeding it is vanishingly small.
- The minimum cell separation (24 px) ensures the midpoint between two adjacent cells has intensity $2 B \exp(-d^2 / 8\sigma^2) = 2 \exp(-2.25) \approx 0.21$, well below the threshold, so adjacent cells are never merged into one component.
SMOOTH_SIGMA = 2.0  # std dev of the Gaussian smoothing kernel (pixels)

# After smoothing, cell peak brightness ≈ σ²/(σ²+σ_s²) = 36/40 ≈ 0.90.
# Threshold 0.5 sits comfortably below 0.90 and well above the smoothed-noise
# ceiling (≈ 5× the smoothed-noise std dev of 0.021; see lesson for derivation).
THRESHOLD = 0.50

# Expected cell area at the operating threshold ≈ π·r_t² where
# r_t = sqrt(−2·ln(threshold/peak)) · σ_eff ≈ 1.085 · 6.32 ≈ 6.9 px, area ≈ 148 px².
# MIN_CELL_SIZE is set well below this to keep real cells while removing noise blobs.
MIN_CELL_SIZE = 30  # minimum pixel count for a detected cell
MIN_SEPARATION is set to 24 pixels rather than a smaller value. Why?
- scipy.ndimage.label cannot separate components closer than 24 pixels
- Wrong: label works at pixel level and separates any two components that do not touch.
- At smaller separations the midpoint intensity between two adjacent cells exceeds the threshold, merging them into one component
- Correct: two Gaussians 24 px apart have midpoint intensity ≈ 0.21, safely below the threshold of 0.50; closer cells would merge.
- The Gaussian smoothing filter blurs cells together unless they are at least $4\sigma$ apart
- Wrong:
SMOOTH_SIGMA= 2, so $4\sigma = 8$ pixels — much less than 24; blurring is not the limiting factor. - 24 pixels is the minimum required by the physical image resolution in microns
- Wrong: the separation is derived from the threshold and cell brightness, not from physical calibration of the microscope.
What the Segmenter Finds in Pure Noise
- The same pipeline applied to an image with no cells at all produces false detections when the threshold is too low.
def make_pure_noise(noise_scale=NOISE_SCALE, image_size=IMAGE_SIZE, seed=SEED):
    """Return an image containing only Gaussian noise, no cell signal.

    Used to demonstrate the false-positive behaviour of the segmentation
    pipeline when the threshold is set below the noise floor.
    """
    rng = np.random.default_rng(seed)
    return np.maximum(rng.normal(0.0, noise_scale, (image_size, image_size)), 0.0)
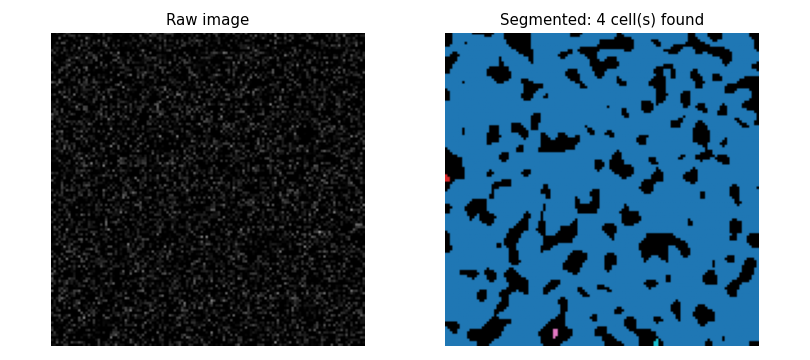
- At threshold 0.05 ($\approx 2.4\,\sigma_\text{noise,smooth}$) roughly 0.8% of pixels exceed the threshold; these cluster into a handful of connected blobs.
- The size filter (MIN_CELL_SIZE = 30 px) removes most noise blobs in practice, because genuine noise excursions are usually smaller than real cells.
- The operating threshold makes the size filter a secondary defence rather than the primary one.
The noise demonstration shows 4 false cells at threshold 0.05 (no size filter)
and 0 false cells at threshold 0.50. What roles do the threshold and MIN_CELL_SIZE play?
- The size filter is the primary defence; the threshold only speeds up computation
- Wrong: without an adequate threshold, large noise clusters pass the size filter too; the threshold does the main work.
- The threshold and the size filter are equally important and interchangeable
- Wrong: they address different failure modes — one filters by intensity, the other by area — and are not interchangeable.
- The threshold is irrelevant as long as the size filter is strict enough
- Wrong: a very low threshold lets many noise pixels cluster into large components that pass the size filter.
- The threshold is the primary defence; the size filter removes small noise blobs that slip past a well-chosen threshold
- Correct: at 0.50 $\approx 24\sigma$, noise exceedances are vanishingly rare; the size filter is a secondary backstop for the few that remain.
Testing
Noise reduction
- Smoothing must reduce pixel-to-pixel variance; an increase would indicate a bug or wrong kernel mode.
Shape preservation
scipy.ndimage.gaussian_filtermust not change the array shape.
Constant image
- A uniform image has no gradients; smoothing must leave its interior values unchanged. The boundary is affected by zero-padding, so only interior pixels are checked.
Cell count
- With
seed=42and default parameters the pipeline must find exactlyN_CELLS = 8cells. This pins the full pipeline — generation, smoothing, thresholding, labelling, and size filtering — against a reproducible synthetic ground truth.
Cell sizes
- All detected cell areas must fall in the range 50-350 px². The analytic value is 148 px²; the bounds give a factor of 3 on each side to absorb noise, overlap, and discretisation effects.
Empty result above maximum
- Setting the threshold above the maximum pixel value must return zero cells.
Pure noise
- At threshold 0.05 pure noise must produce at least one false detection, showing that parameter choice matters.
- At the operating threshold it must produce none, showing the threshold is adequate.
import numpy as np
from generate_image import make_image, make_pure_noise, N_CELLS, IMAGE_SIZE
from cellseg import smooth, segment, cell_sizes, THRESHOLD


def test_smooth_reduces_noise():
    # Gaussian smoothing must reduce pixel-to-pixel variance.
    rng = np.random.default_rng(7)
    noise = rng.normal(0, 1, (64, 64))
    assert smooth(noise, sigma=2).var() < noise.var()


def test_smooth_preserves_shape():
    image = np.ones((IMAGE_SIZE, IMAGE_SIZE))
    assert smooth(image).shape == image.shape


def test_smooth_constant_unchanged():
    # Smoothing a uniform image must leave interior values unchanged.
    image = np.full((50, 50), 0.7)
    result = smooth(image, sigma=2)
    interior = result[4:-4, 4:-4]
    assert np.allclose(interior, 0.7, atol=1e-6)


def test_segment_finds_all_cells():
    # With default parameters the pipeline must recover all N_CELLS cells.
    image, centers = make_image()
    labeled, n_found = segment(smooth(image))
    assert n_found == N_CELLS, f"Expected {N_CELLS} cells, found {n_found}"


def test_cell_sizes_reasonable():
    # Every detected cell must have a pixel area in the physically plausible range.
    # At the operating threshold the analytic area is ≈ 148 px²; we allow 50–350 px²
    # to accommodate smoothing and noise effects without being unnecessarily tight.
    image, _ = make_image()
    labeled, _ = segment(smooth(image))
    sizes = cell_sizes(labeled)
    assert np.all(sizes >= 50), f"Cell too small: {sizes.min()} px"
    assert np.all(sizes <= 350), f"Cell too large: {sizes.max()} px"


def test_threshold_above_max_finds_nothing():
    # A threshold above the maximum smoothed value must produce zero cells.
    image, _ = make_image()
    labeled, n_found = segment(smooth(image), threshold=999.0)
    assert n_found == 0


def test_pure_noise_false_positives():
    # At a threshold of 0.05, pure noise produces false detections.
    # Smoothed noise std dev ≈ NOISE_SCALE / (2·sqrt(π)·SMOOTH_SIGMA) ≈ 0.021;
    # 0.05 ≈ 2.4σ, so roughly 0.8% of pixels exceed it, forming several blobs.
    noise = make_pure_noise()
    _, n_false = segment(smooth(noise), threshold=0.05)
    assert n_false > 0, "Expected false positives from pure noise at threshold 0.05"

    # At the operating threshold (0.50 ≈ 24σ) pure noise must not trigger any cell.
    _, n_safe = segment(smooth(noise), threshold=THRESHOLD)
    assert n_safe == 0, "Operating threshold should reject all noise blobs"
Exercises
Watershed segmentation
The thresholding approach fails when two cells overlap and merge into a single connected
component. Implement watershed segmentation: compute the distance transform of the
binary mask (scipy.ndimage.distance_transform_edt), find local maxima of the distance
map as seed points, and use scipy.ndimage.watershed_ift (or skimage.segmentation.watershed)
to split overlapping regions. Demonstrate that it correctly separates two cells whose
centres are only 14 pixels apart (closer than MIN_SEPARATION).
Intensity-based cell classification
Add a second cell type to make_image: dim cells with brightness=0.4 alongside the
standard bright cells with brightness=1.0. Extend segment to return a label array
and a list of per-cell mean intensities, then classify each detected cell as bright or
dim using a simple intensity threshold. Report precision and recall for each class.
Effect of noise on count accuracy
Generate 50 images for each of five noise levels: $\sigma_\text{noise} \in {0.05, 0.10, 0.15, 0.20, 0.25}$. Run the full pipeline on each image and record the number of cells found. Plot mean and standard deviation of the cell count as a function of noise level and identify the noise level at which the pipeline begins to fail consistently.
Adaptive thresholding
Real microscopy images often have uneven illumination: the background is brighter in some
regions than others. Simulate this by adding a low-frequency gradient
$G(x,y) = 0.2 \cdot x / \text{IMAGE_SIZE}$ to the synthetic image before adding noise.
Show that the global threshold misses cells in dark regions or over-detects in bright
regions, then implement local thresholding (scipy.ndimage.generic_filter with a
percentile-based local estimate) and show that it restores accurate cell counts.